

Visualization portal
The visualization portal is the environment where the user can access reports, applications, paginated reports and dashboards.
It is a white-label portal, which means that it can be fully customized according to the client's visual identity.
It is also a multi-language portal, ideal for international scenarios.
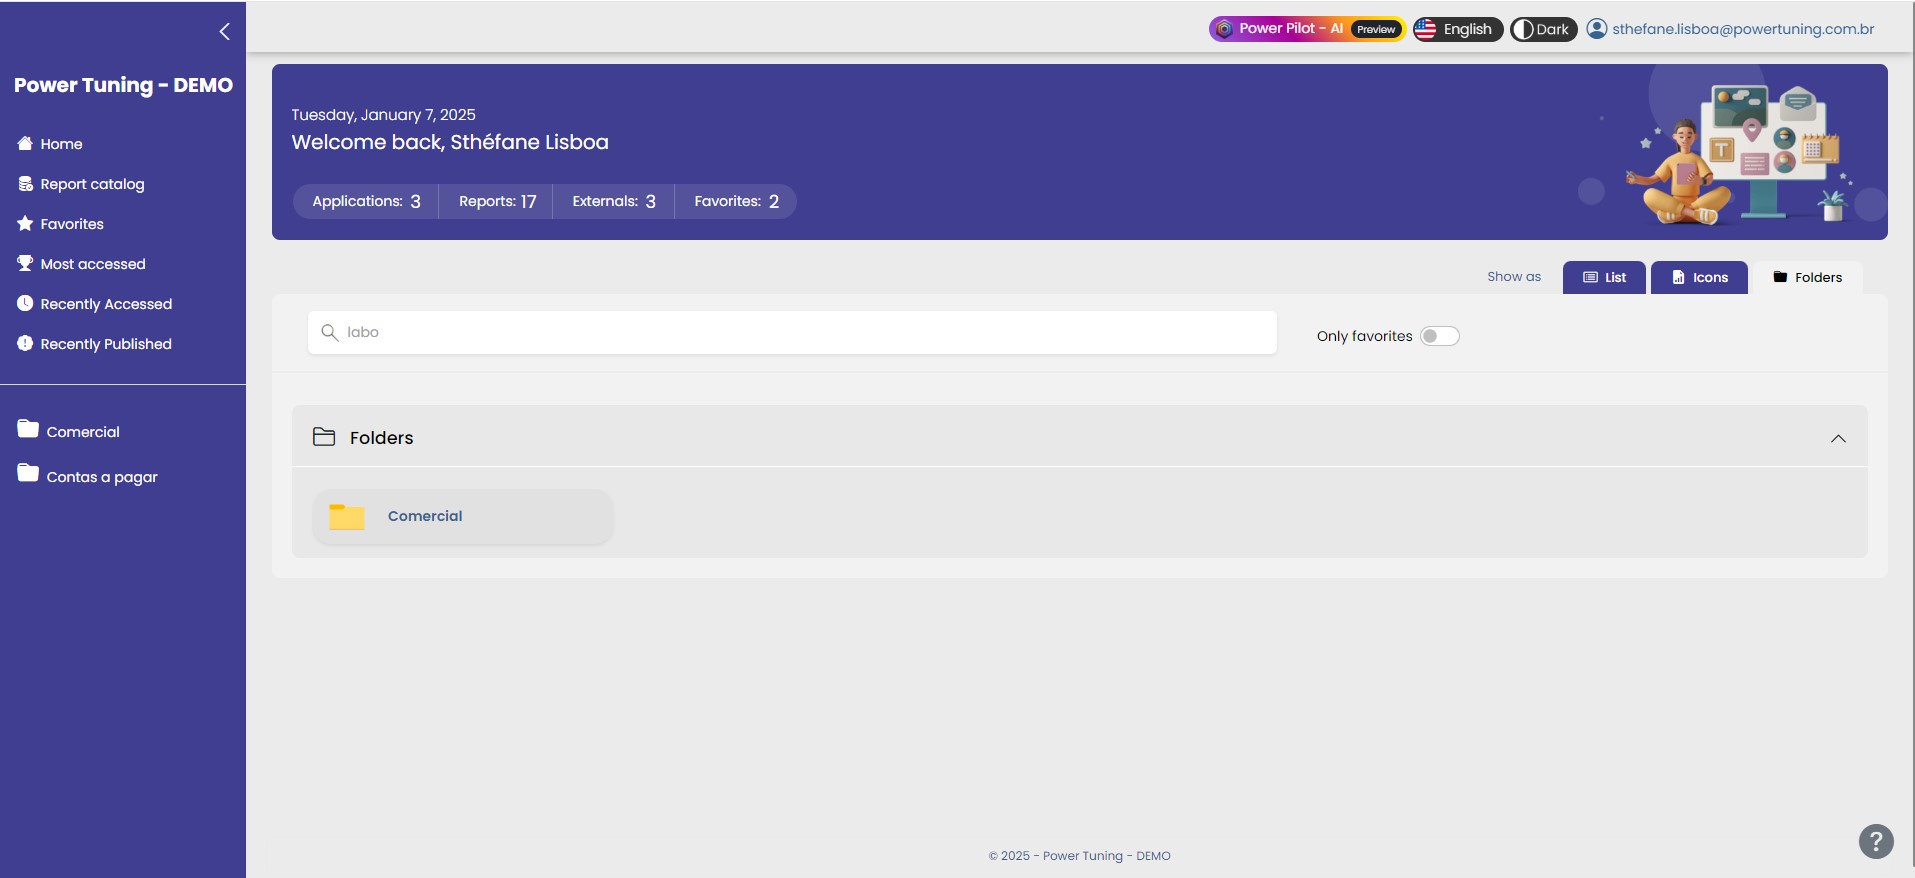
At the start, the user already has access to some metrics from the available dashboards and can click to be redirected directly to them. In the same menu, you can choose between three types of report view:
List: A view similar to that of the Power BI workspace.
Icons: Very useful when the user has access to several reports and needs to identify each one quickly.
Folders: This view offers a clearer organization of the environment, allowing you to see the folders where the reports are inserted and also the division between Reports, Applications and dashboards individually.
To make it easier to find these reports, you can search by specific name or even filter to display only the reports marked as favorites.
Side Menu Features
Report Catalog: A discovery tool that lets you showcase the reports available in the company. With it, users can see which reports already exist and, if they find one relevant to their daily activities, request access in a practical, centralized way.
Favorites: The logged-in user’s favorite reports can be easily marked with a star next to the report.
Most Accessed: Displays the reports most accessed by the user.
Recently Accessed: Lists the reports the user has accessed recently.
Recently Published: Shows recently published reports that the logged-in user has access to.
In the side menu, in addition to the information above, you can also view the folders.
Report Catalog
The Report Catalog is a tool that displays preview information about the reports available in the system. This feature is especially useful when you want users to know that certain reports exist before they request access.
If a user wants to view a specific report, they must submit an access request. But note: a report will only appear in the catalog if the “Show in Report Catalog” option is enabled in its settings.
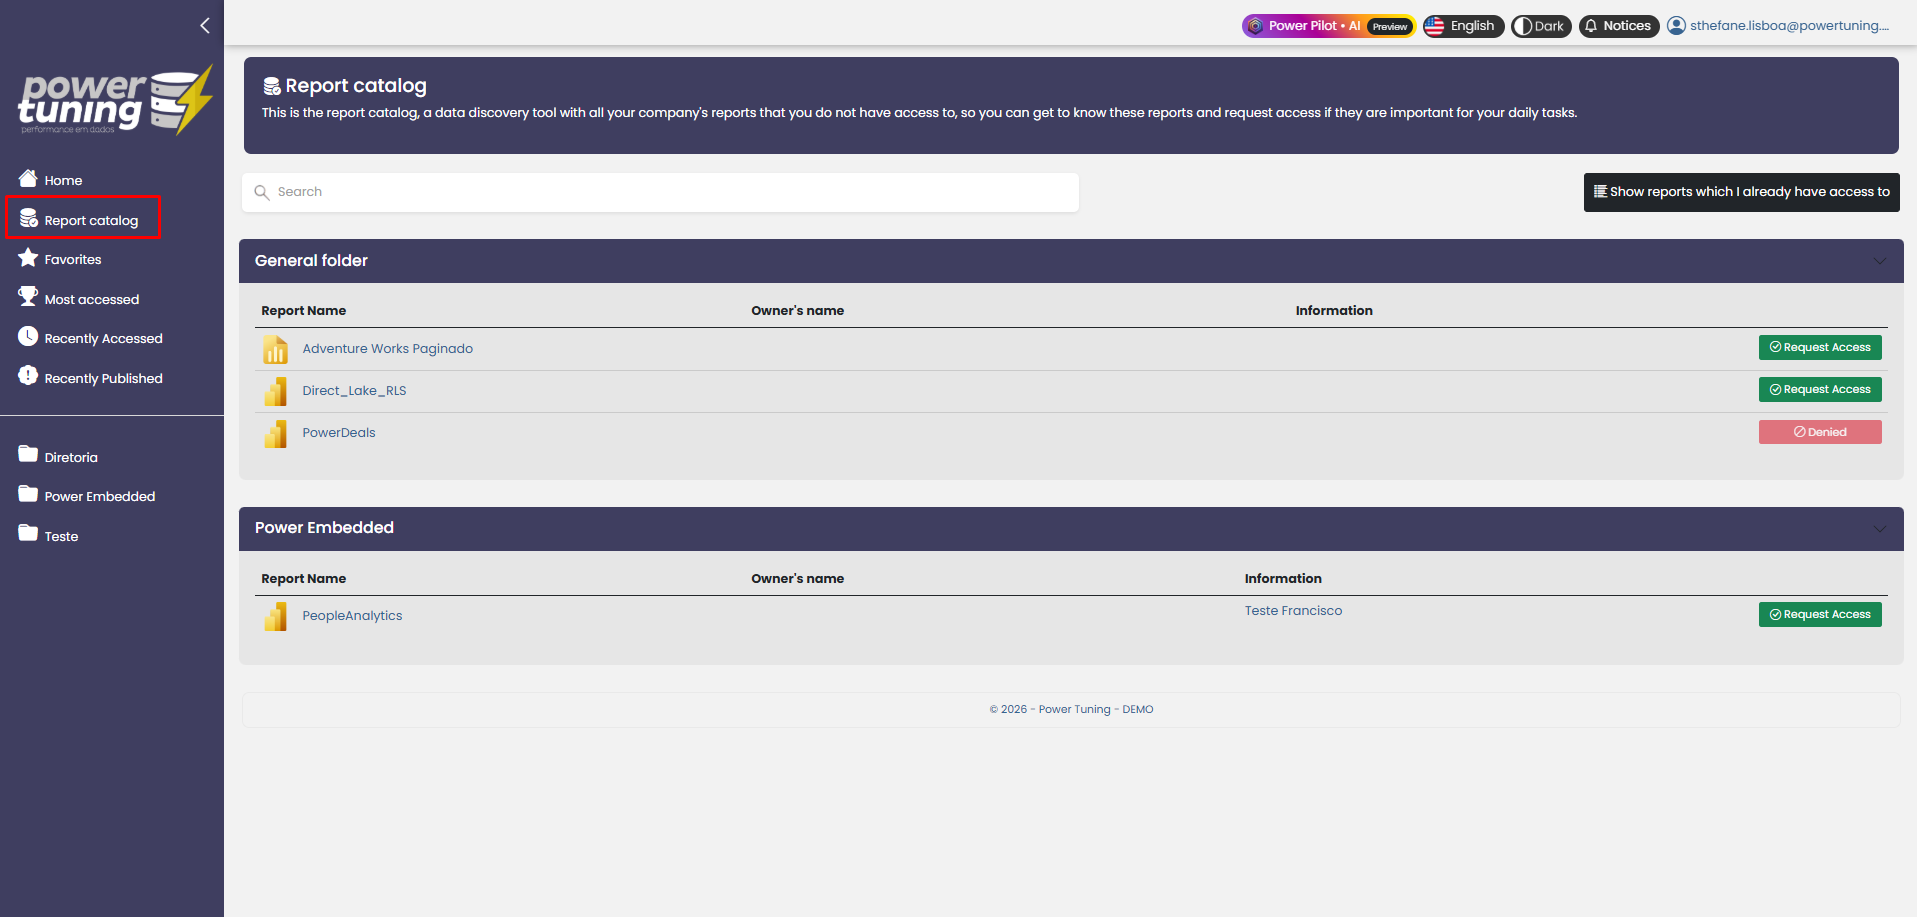
The report is displayed exclusively on this screen, and only if the “Show in report catalog” option is enabled in the report’s registration settings.
When the report is made available in the data catalog, users can request access by providing a justification for viewing the report.
After the access request is submitted, both the administrators and the contributors of the workspaces associated with the report are notified by email and through the viewing portal.
The notification is displayed as shown in the example screen below.
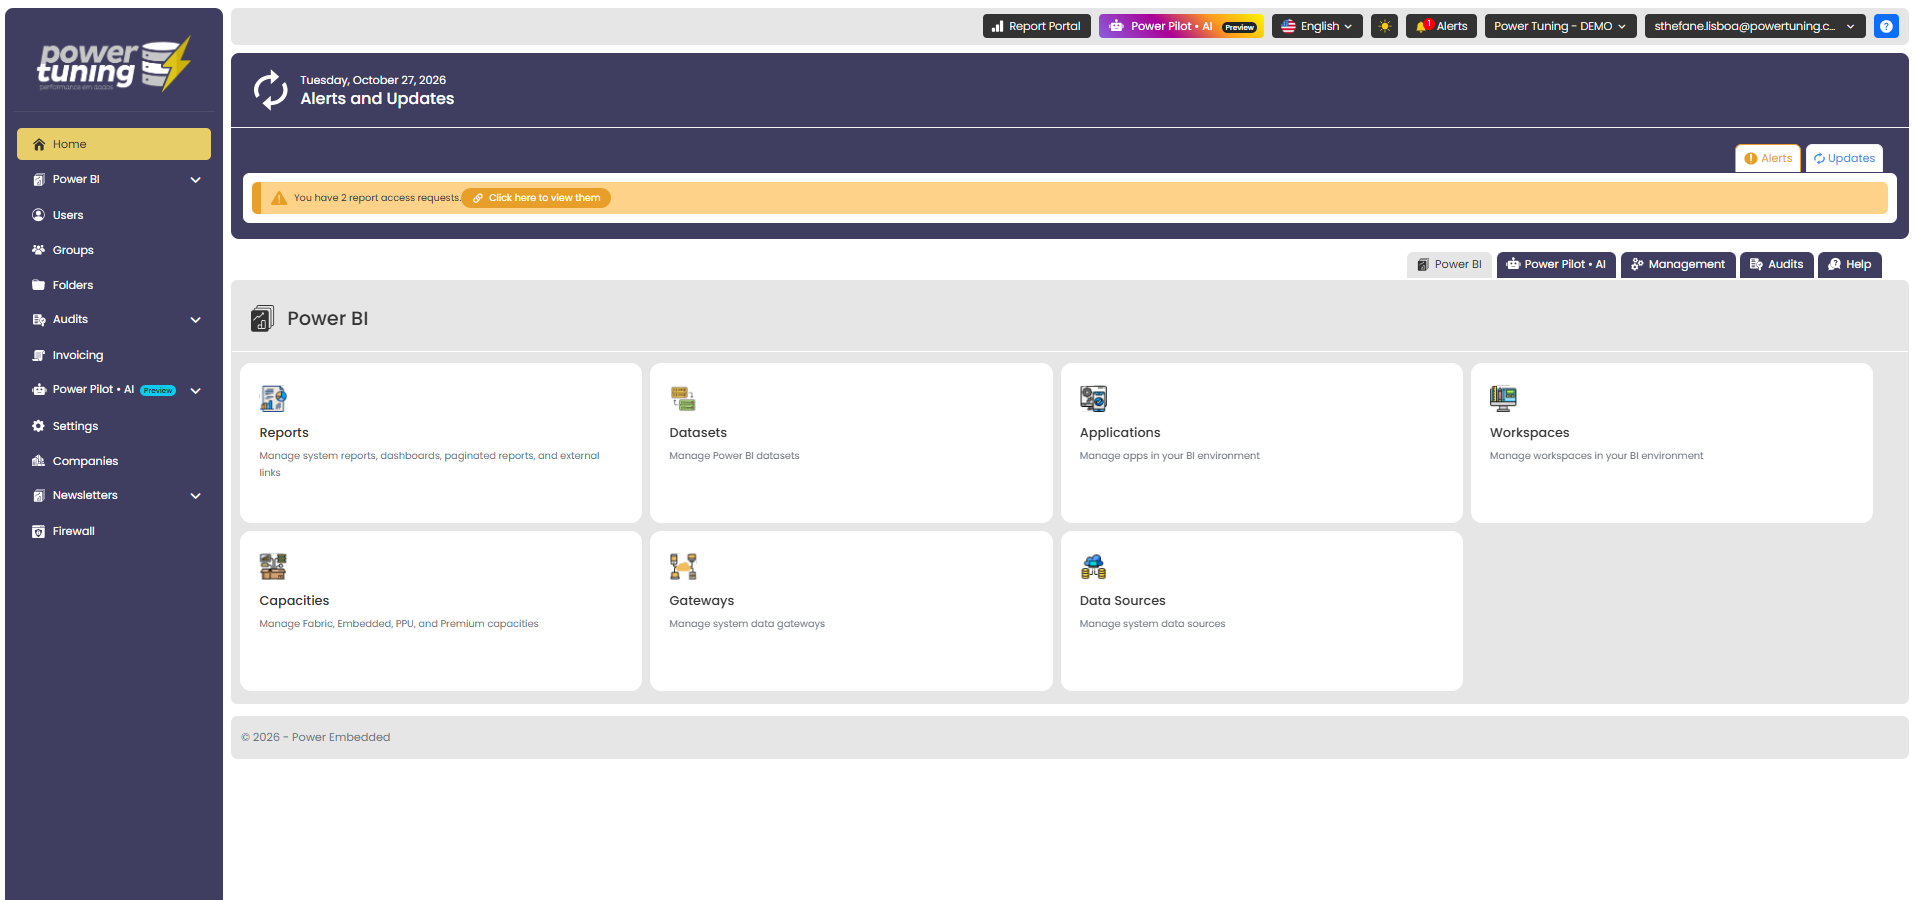

To ensure effective management of access requests, the system sends automatic alerts, allowing those responsible to review and approve or reject the access requests.
Administrators and contributors can manage these requests directly from the viewing portal, making it easier to control and secure the information.